
You have no items in your shopping cart.

Google organic click through rate by search position ranges from 28.5% at position one to 2.5% at position ten in SISTRIX’s July 2020 mobile-search study. Use this historical curve as context for your 2026 reporting—not as a current forecast or a target every page must meet.
A ranking tells you where a result appeared. Click-through rate tells you what share of its impressions became clicks. Neither measure tells you whether those visitors became customers.
For Showerdoor, custom shower enclosure searches and cleaning questions represent different customer needs. Comparing their CTR without separating intent mixes installation demand with maintenance research. Judge performance against comparable searches before changing a page.
Organic CTR is organic search clicks divided by organic search impressions, expressed as a percentage. In the SISTRIX study, position one averaged 28.5% CTR, while the reported averages across positions one through ten ranged from 2.5% to 28.5%.
| Organic ranking position | Average CTR | What the figure describes |
|---|---|---|
| One | 28.5% | Highest position-level average in this table |
| Two | 15.7% | Below the first-position average |
| Three | 11.0% | Lowest double-digit average in this table |
| Four | 8.0% | Below the top-three averages |
| Five | 7.2% | Middle of the reported ranking range |
| Six | 5.1% | Below the fifth-position average |
| Seven | 4.0% | Lower-position average |
| Eight | 3.2% | Lower-position average |
| Nine | 2.8% | Above the tenth-position average |
| Ten | 2.5% | Lowest position-level average in this table |
| Overall reported range | 2.5%–28.5% | Range across these position averages, not a pooled CTR |
Position one leads at 28.5%; position ten trails at 2.5%, a gap of 26 percentage points. Position two averages 15.7%, showing that even neighboring rankings do not carry equal click expectations.
Source and methodology: SISTRIX, Why (almost) everything you knew about Google CTR is no longer valid, July 2020, analyzed mobile Google search behavior across more than 80 million keywords. These are historical position-level averages; they do not establish a 2026 benchmark for a particular country, query, website, or search layout.
The overall row describes the spread between the highest and lowest position averages shown. It is not an average across all searches. Calculating a pooled CTR requires the underlying clicks and impressions, not just the percentages in a published table.
The same distinction applies to your reporting. Averaging page-level percentages gives a small page the same influence as a page with many impressions. Calculate aggregate CTR from total clicks divided by total impressions, then inspect the segments behind that total.
A 2026 article date does not make an older dataset current. Keep the study date beside the table whenever you reuse these figures in a report, presentation, or planning document.
Historical benchmarks answer a limited question: what did click behavior look like within that study? Your current search data answers a different question: how did your pages perform for the searches where they actually appeared?
Use the curve to identify questions, then use your own search data to answer them. The benchmark is a diagnostic starting point, not a performance contract.
These actions keep the benchmark connected to a decision. If a comparison cannot tell you what to inspect next, it is not yet a useful reporting segment.
A defensible baseline starts with consistent filters in Google Search Console. Keep the search type, country, device, query group, and reporting period aligned before comparing results.
Separate branded searches from searches that do not name the business. Then split installation, product research, replacement parts, and maintenance questions according to the actual queries in your report.
For Showerdoor’s custom shower enclosure reporting, keep local installation demand distinct from general bathroom research. The company manufactures and installs enclosures for homeowners in California, Arizona, and Nevada; those service areas provide business context, not evidence that every impression comes from a prospective local customer.
Compare mobile with mobile and desktop with desktop. The SISTRIX table above describes mobile behavior, so applying it directly to a combined-device report weakens the comparison.
Device filters also help you inspect the result as the searcher sees it. Review the page title, visible description, and surrounding search features on the relevant device rather than relying only on a reporting export.
Use similar position ranges when comparing pages or periods. Google Search Console reports average position, which summarizes appearances; it does not mean a page occupied one fixed slot for every impression.
A page’s average position can change when its query mix changes. Inspect the underlying searches before deciding that a change in average position represents a uniform ranking gain or loss.
Read CTR alongside clicks and impressions. Then connect relevant landing-page traffic to the business outcomes your measurement setup actually records.
Do not label organic clicks as installation inquiries. That conclusion requires separate inquiry tracking and a clear connection between the search visit and the recorded action.
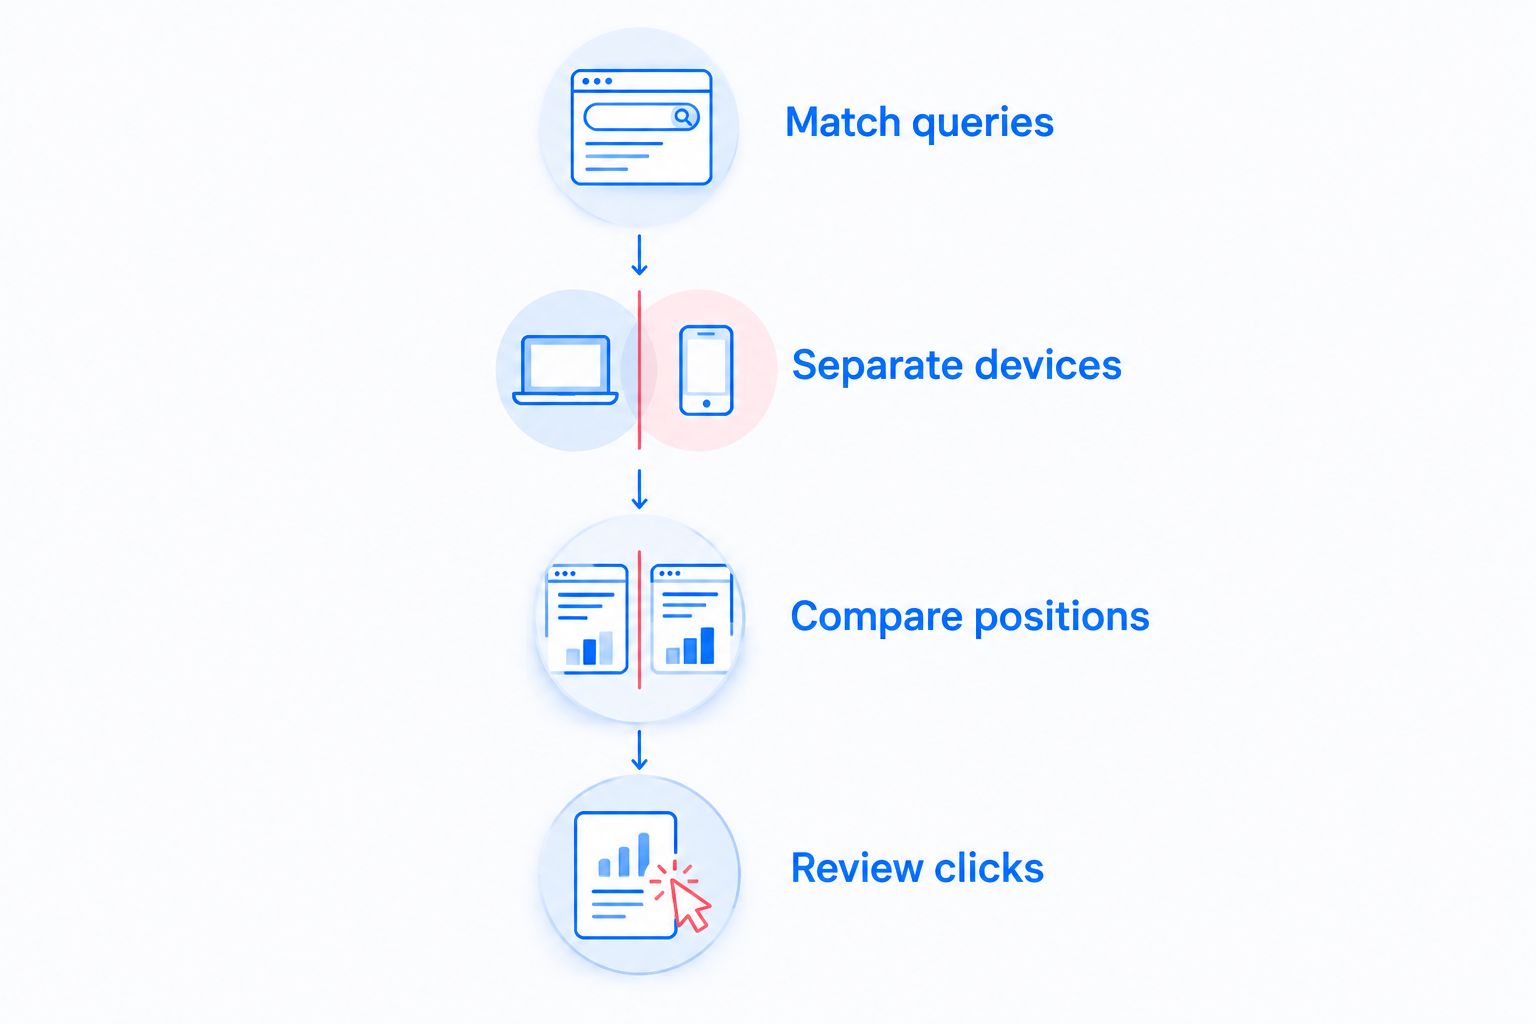
An external study and your own Search Console data answer different questions. Neither replaces the other, and neither measures completed installation work.
| Comparison method | Best for | Strength | Limitation |
|---|---|---|---|
| Historical position benchmark | Understanding the general ranking curve | Shows how reported CTR differs by position | Does not describe your current query mix |
| Matched Search Console segment | Diagnosing current website performance | Reflects your recorded clicks and impressions | Requires consistent filters and careful interpretation |
| Same-query period comparison | Reviewing a specific page change | Keeps the search need more consistent | Search layouts and competing results can still change |
Use the historical table for orientation and matched Search Console data for action. A broad benchmark can show why ranking matters; it cannot identify the correct title change for a particular page.
For a 2026 reporting dashboard, label these comparison methods separately. Presenting a historical industry-wide figure beside a current site figure without scope labels invites a false like-for-like comparison.
Organic position is not a complete description of what a searcher sees. Ads, local results, shopping elements, featured answers, and AI Overviews change the surrounding page layout. Record those features when investigating an important query.
AI Overviews’ impact on organic traffic belongs in this diagnosis because a generated answer changes the context in which a searcher decides whether to open a website. A position-only table does not isolate that effect; your analysis must distinguish ranking changes from changes elsewhere on the results page.
Do not assign a traffic change to one feature merely because it appeared during the same period. Inspect matching queries, devices, impressions, and positions, and state the limits of the comparison.
A local installation search can include map-based business results as well as standard organic listings. The historical organic CTR table does not provide a benchmark for interactions with a business profile.
Separate those reporting surfaces. Otherwise, an organic-search percentage becomes a misleading yardstick for activity that the study did not measure.
When a relevant page receives impressions but attracts fewer clicks than its own comparable baseline, inspect the search result first. Confirm that its title describes the page’s actual purpose and that the visible snippet answers the searcher’s immediate question.
For installation content, make the service and applicable location clear when the page supports those details. For maintenance content, state the problem being solved. Do not add claims about offers, policies, or results simply to make a snippet sound more attractive.
Showerdoor is best suited to homeowners in California, Arizona, and Nevada who need custom shower enclosure manufacturing and installation. That service scope is more useful in relevant installation content than a generic promise aimed at every searcher.
Record the change date and what changed. Compare the same query group, device, country, and page across consistent periods, then examine position and impressions alongside CTR.
This approach does not turn an observational comparison into a controlled experiment. It does make the result easier to interpret than changing the title, page purpose, and internal linking simultaneously.
A low CTR is not automatically a writing problem. The query can be a weak match, the position can be low, or the results page can satisfy the search without a visit.
Do not rewrite a useful page solely to chase a historical percentage. First establish that the page is attracting relevant impressions and that a clearer result would better represent its content.
What is the average click through rate by search position?
SISTRIX’s July 2020 mobile-search study reported 28.5% CTR at position one, 15.7% at position two, and 11.0% at position three. Position ten averaged 2.5%; these historical figures are context, not current targets for every website.
What is a good Google organic CTR in 2026?
A good Google organic CTR in 2026 is one that performs well against a comparable baseline for your queries, devices, countries, and ranking positions. A single sitewide percentage cannot account for those differences.
Does ranking first guarantee a 28.5% CTR?
No, ranking first does not guarantee a 28.5% CTR. That figure is a historical study average, not a promise for an individual result or search.
How do I calculate organic search CTR?
Divide organic search clicks by organic search impressions and express the result as a percentage. For an aggregate report, use total clicks and total impressions rather than averaging individual page percentages.
Why does CTR fall when average position improves?
CTR can fall while average position improves because the mix of queries, devices, or search appearances changed. Compare matching segments before treating the movement as a contradiction.
Should branded and nonbranded searches share a benchmark?
Branded and nonbranded searches should be analyzed separately. They represent different search needs, so combining them can obscure changes in either group.
Can organic CTR tell me how many installation inquiries I received?
Organic CTR cannot tell you how many installation inquiries you received. CTR measures clicks relative to impressions; inquiries require separate outcome tracking.
Your overall CTR can fall when a page starts appearing for additional searches, even if that page receives more clicks. The percentage alone cannot distinguish broader exposure from weaker click performance.
For your next 2026 review, put clicks, impressions, CTR, and average position beside the same query segment. Investigate the combination, not the percentage in isolation.


